Adoption & Network Intelligence
Track adoption across your dealer network, measure field intelligence capture, calculate ROI, and surface resolution patterns the OEM can act on.
What this page does
The Adoption Dashboard measures two things: whether your network is actually using Planara, and whether the field intelligence loop is doing anything useful.
For a single dealer, it shows technician adoption, query patterns, and ROI. For an OEM with a dealer network, it shows all of that plus network-wide resolution patterns, cross-dealer knowledge gaps, and field intelligence metrics that connect to documentation and product decisions.
This is the page you show to the VP of Service Operations who approved the deployment — and the one that makes the case for going from pilot to full rollout.
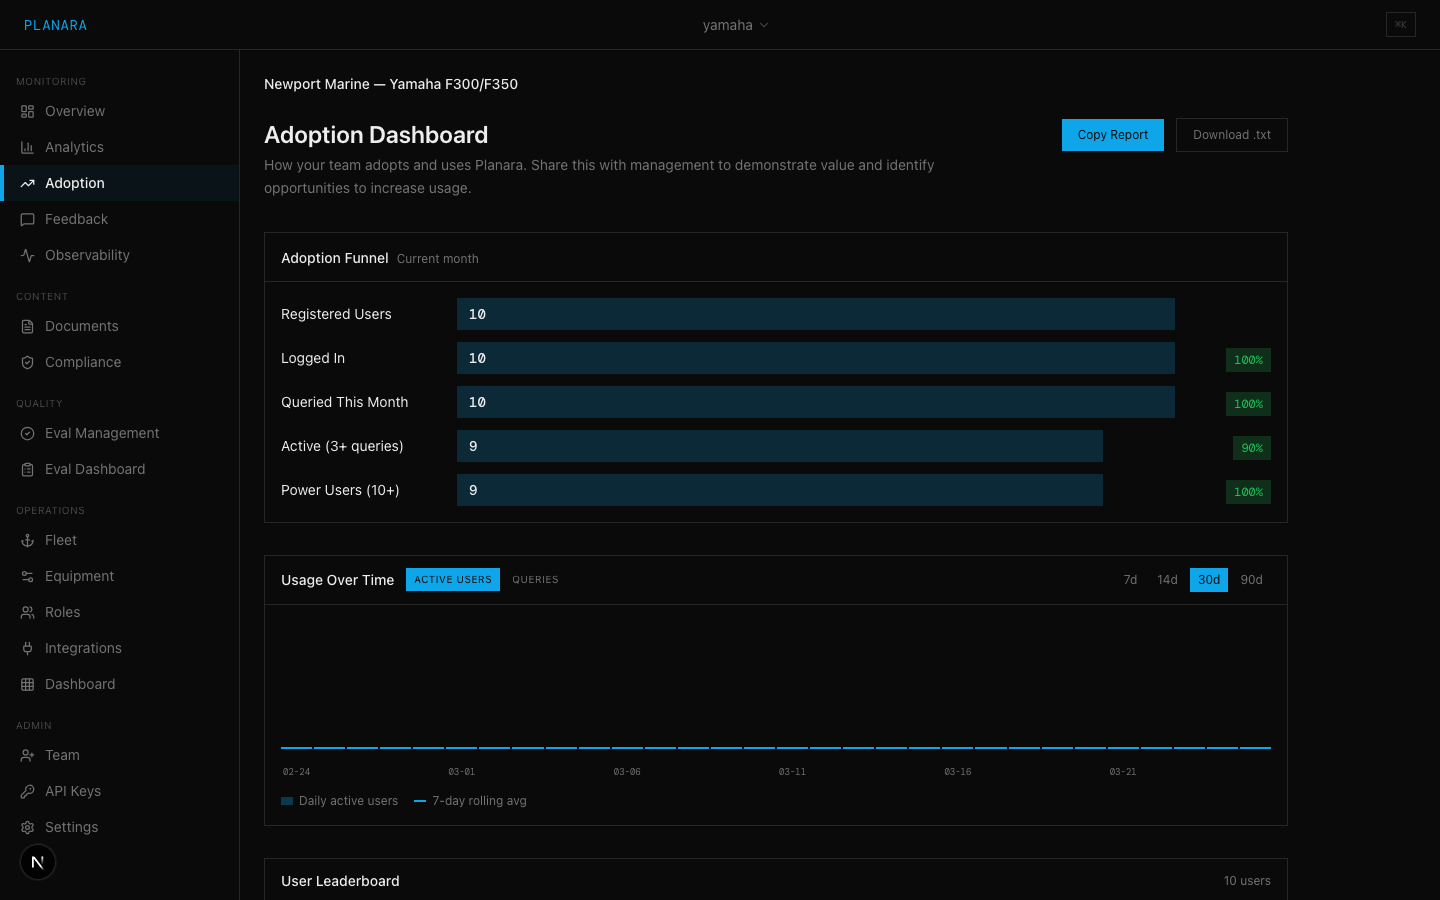
Adoption funnel
The funnel tracks five stages of user adoption for the current month:
| Stage | Definition | What it measures |
|---|---|---|
| Registered Users | Users with accounts in the namespace | Has the team been onboarded? |
| Logged In | Users who have signed in at least once this month | Are they aware the tool exists? |
| Queried This Month | Users who have submitted at least 1 query | Have they tried it? |
| Active (3+ queries) | Users with 3 or more queries this month | Are they using it regularly? |
| Power Users (10+) | Users with 10 or more queries this month | Who are your champions? |
Each stage shows the count and the conversion rate from the previous stage. Color coding: green (50%+), yellow (25-50%), red (below 25%).
A healthy deployment shows:
- 80%+ of registered users logging in
- 50%+ of logged-in users querying
- 30%+ of querying users becoming active
If drop-off is steep between "Logged In" and "Queried This Month," the issue is usually awareness or trust -- technicians don't know what to ask, or they tried it once and got a bad answer. Focus on the first 10 queries experience.
User leaderboard
A ranked table of users by query volume with columns for:
- Total queries this month
- Positive feedback count
- Negative feedback count
- Satisfaction rate (positive / total feedback)
- Last active timestamp
The leaderboard helps identify:
- Champions who are using the tool daily and giving positive feedback
- Struggling users with high negative feedback rates (may need training or the content may not cover their specialty)
- Non-adopters who registered but never query (consider pairing with a champion)
ROI Calculator
An interactive calculator that estimates the financial return on Planara based on actual usage data. Configurable inputs:
| Input | Description | Default |
|---|---|---|
| Hourly rate | Fully loaded technician cost per hour | $85 |
| Troubleshooting time without Planara | Average minutes to resolve an issue without AI assistance | 45 min |
| Annual license cost | What the customer pays per year for Planara | $0 |
The calculator uses real data from the current month:
- Active user count from the adoption funnel
- Total queries this month from the analytics pipeline
- Average session duration from session tracking
It computes:
- Time saved per incident: troubleshooting time without Planara minus average session duration
- Monthly time saved: incidents per month times time saved per incident
- Monthly cost savings: time saved times hourly rate
- Annual savings projection: monthly savings times 12
- Months to payoff: annual license cost divided by monthly savings
ROI configuration is saved per-namespace in the platform database so it persists across sessions. Click "Save" to store updated inputs.
Report generator
Generates a formatted report suitable for stakeholder presentations. The report includes:
- Executive summary with headline ROI metrics
- Adoption funnel visualization
- User activity breakdown
- Query volume and satisfaction trends
- Month-over-month comparison (if data is available)
Reports can be exported as PDF or copied as formatted text for inclusion in email updates or slide decks.
Network intelligence (OEM view)
For OEM administrators with cross-namespace visibility, the Adoption Dashboard shows what no single dealer can see on its own:
Resolution patterns
- Cross-dealer resolution analytics — for a given symptom and equipment model, what percentage of cases are resolved by each procedure across the network. When the manual says "replace the thermostat" but 60% of techs find the actual root cause is the tell-tale water passage, this is where that shows up.
- First-time fix rate by dealer — which dealers consistently resolve on the first attempt, which require multiple attempts, and what distinguishes them (training, equipment age, documentation coverage).
- Documentation gap heatmap — topics with high query volume and low confidence or high negative feedback, ranked by frequency across the network. These are the places where the documentation isn't working.
Field issue detection
The network view surfaces signals that would take weeks to find through traditional field engineering:
- Query spikes — sudden increase in queries about the same symptom across multiple dealers, correlated by geography, equipment model, or production batch
- Correction clusters — multiple dealers submitting the same correction independently, pointing to a systematic documentation gap
- Seasonal patterns — diagnostic patterns that correlate with season or climate (fuel system issues after winter storage, corrosion in coastal regions)
Each signal comes with the underlying query data, dealer distribution, and equipment model correlation — enough to act on without digging further.
Knowledge capture metrics
- Active corrections — total field-validated corrections in the knowledge base, by equipment model and category
- Correction adoption — how often active corrections appear in responses and whether they improve resolution rates
- Diagnostic template performance — success rate, usage count, and average resolution time for each diagnostic path
- Knowledge velocity — rate of new corrections and diagnostic improvements entering the system per week
Data sources
The adoption dashboard pulls from:
| Data | Source |
|---|---|
| User counts | User accounts in the namespace |
| Login activity | Authentication provider sessions |
| Query counts | Feedback records (one row per query with feedback) |
| Session duration | Session tracking events |
| ROI config | Per-tenant configuration |
| Resolution outcomes | Step-level outcome tracking |
| Corrections | Correction records (submitted, validated, active) |
| Diagnostic performance | Diagnostic template metrics |
For single-tenant deployments, analytics are scoped to the namespace. For OEM network deployments, the OEM admin role provides cross-namespace aggregation with individual dealer drill-down.
Related
- Analytics — query quality analytics and product analytics integration
- Overview Dashboard — high-level operational metrics
- Feedback — individual feedback entries and trends
- Field Intelligence — how repair outcomes flow through the learning loop