Feedback
Review individual feedback entries, identify patterns, and find documentation gaps.
What this page does
The Feedback page shows every thumbs-up and thumbs-down response from your technicians and owners. Use it to understand which answers are working and which are not, find patterns in negative feedback, and prioritize documentation improvements.
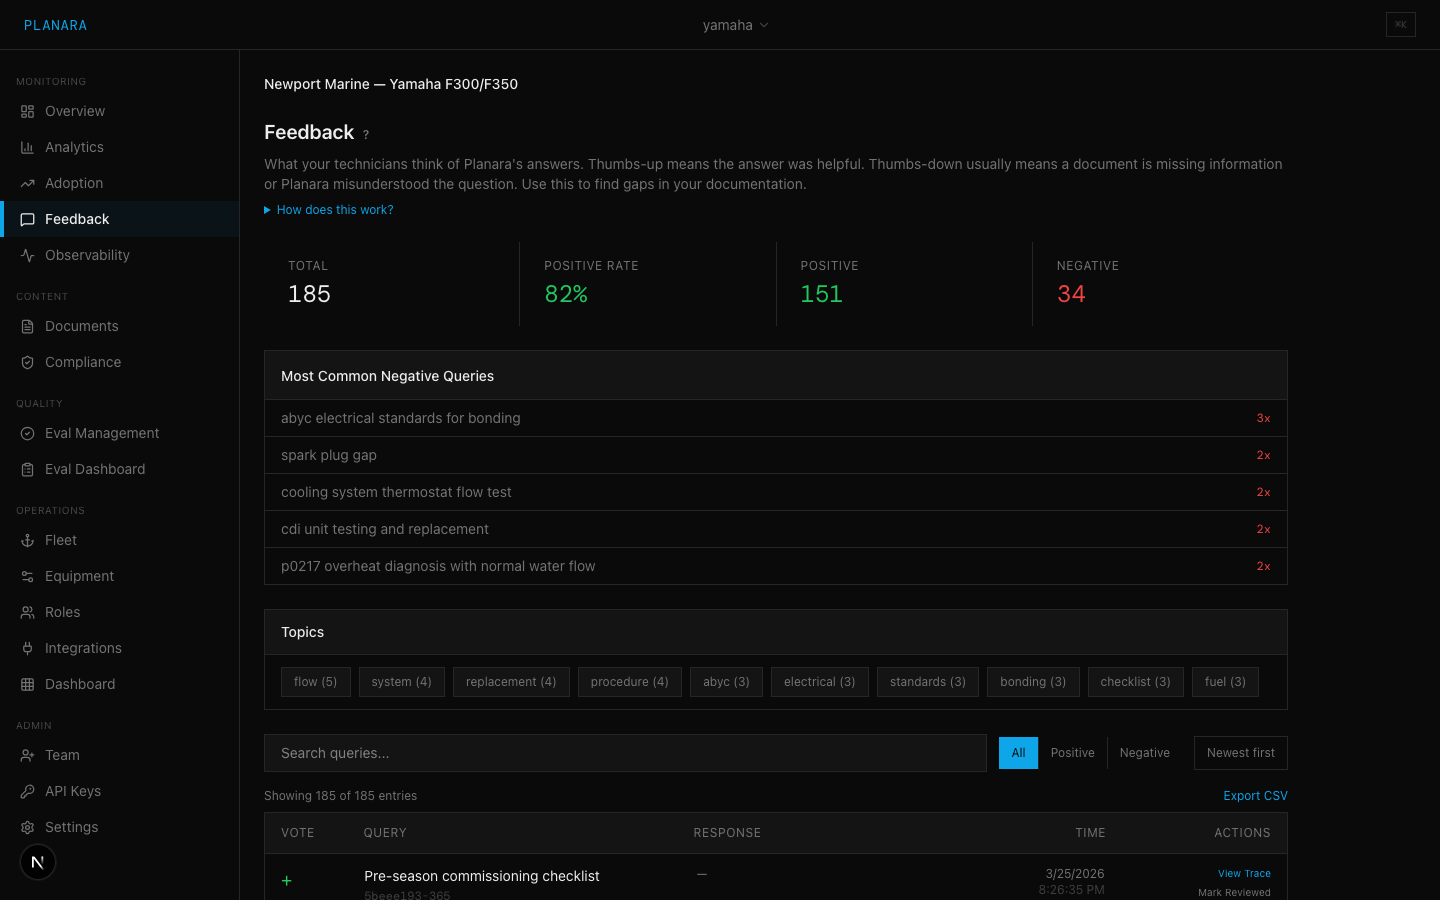
Summary stats
Four cards at the top of the page:
| Metric | Description |
|---|---|
| Total | All feedback entries ever recorded for this namespace |
| Positive Rate | Percentage of positive feedback (green) |
| Positive | Total thumbs-up count |
| Negative | Total thumbs-down count |
Most Common Negative Queries
A ranked list of the most frequently occurring negative feedback queries. Each entry shows the query text and a count multiplier (e.g., 3x). This is your fastest signal for content gaps -- if the same question keeps getting bad answers, you need to upload better documentation for that topic.
Topic Clusters
Negative feedback grouped by keyword. Planara extracts meaningful keywords from negative queries and clusters them by frequency. Each keyword shows a count of how many negative entries contain it.
Click a keyword to filter the feedback list below to only entries containing that keyword. Click again or click "Clear filter" to remove the filter.
What to look for: Large clusters around specific keywords (e.g., "winterization 5", "oil 4") indicate topic areas where your documentation is weak.
Filters and controls
- Search -- free text search across query text and response summaries
- Sentiment filter -- toggle between All, Positive, and Negative
- Sort -- toggle between Newest first and Oldest first
- Export CSV -- download the current filtered view as a CSV file
Feedback list
The main table shows individual feedback entries:
| Column | Description |
|---|---|
| Vote | + (green, positive) or - (red, negative) |
| Query | The original question text. Session ID shown below in monospace. |
| Response | Truncated summary of what Planara answered (first 150 chars) |
| Time | Date and time of the feedback |
| Actions | "View Trace" opens the full trace for deep inspection. "Mark Reviewed" is a local toggle (not persisted) for tracking your review progress. |
The list is scrollable and limited to 500 entries.
Workflow: Investigating negative feedback
- Start with Most Common Negative Queries -- these are your highest-impact items
- Click a query to see its topic cluster context
- Use the Sentiment filter set to "Negative" and search for the topic keyword
- For each negative entry, click "View Trace" to see the full trace: what chunks were retrieved, what the system generated, and why the answer was poor
- Determine whether the issue is a missing document (upload new content) or a retrieval problem (the content exists but was not found)
- After resolving, mark entries as "Reviewed" to track your progress