Analytics
Deep dive into query patterns, feedback trends, and per-user activity.
What this page does
The Analytics page provides a deeper view into how your team uses Planara than the Overview Dashboard. It is built on feedback signals (thumbs up/down) that technicians provide after receiving answers.
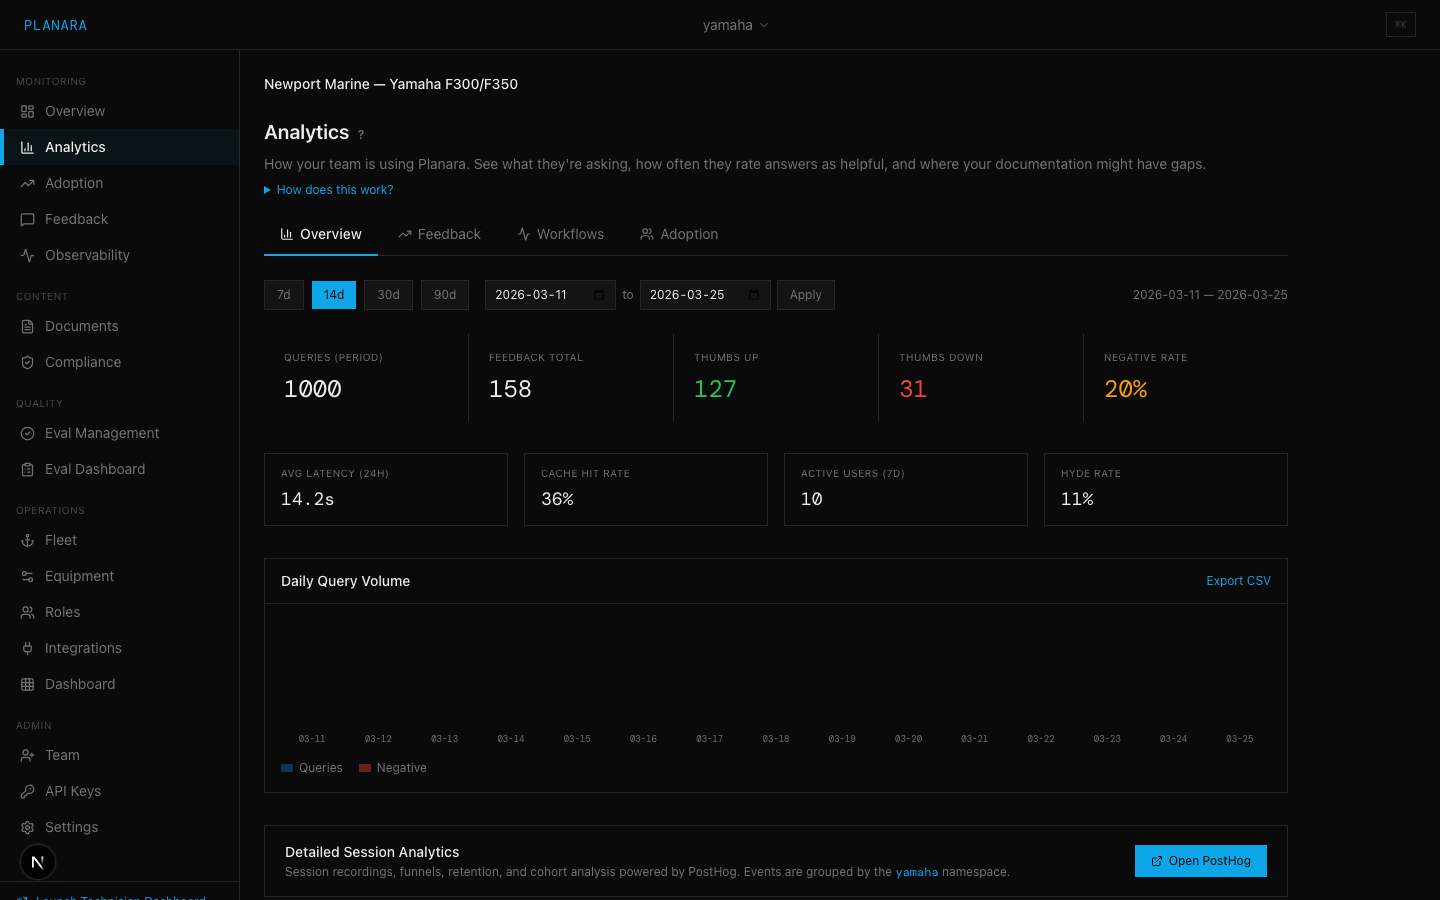
Date range selector
At the top of the page, choose a time range for all analytics below:
- Preset buttons: 7d, 14d, 30d, 90d
- Custom range: Pick specific start and end dates
- The selected range persists in the URL as query parameters (
?range=14dor?from=2026-03-01&to=2026-03-15), so you can bookmark or share specific date ranges.
KPI Cards
Four summary metrics for the selected period:
| Metric | Description |
|---|---|
| Total Queries | Number of feedback entries in the selected period |
| Thumbs Up | Positive feedback count (green) |
| Thumbs Down | Negative feedback count (red) |
| Negative Rate | Percentage of negative feedback. Color-coded: green (under 10%), yellow (10-20%), red (over 20%). An asterisk (*) appears when the sample size is below 10, indicating the rate may not be reliable. |
Daily Query Volume
A bar chart showing feedback volume per day. Each bar has two layers:
- Blue (queries) -- total feedback entries that day
- Red (negative) -- negative feedback entries overlaid on the total
Hover over a bar to see exact counts. Use the "Export CSV" button in the section header to download daily stats.
What to look for: Days with high negative-to-total ratios may indicate a content issue introduced that day (e.g., a bad document re-ingestion).
Per-User Activity
A table showing the top 20 users by query volume:
| Column | Description |
|---|---|
| User | Email address (or "anonymous" for unauthenticated queries) |
| Queries | Total feedback entries from this user |
| Positive | Thumbs-up count (green) |
| Negative | Thumbs-down count (red) |
Use "Export CSV" to download the full user breakdown.
What to look for: Users with high negative rates may need training or may be asking questions your documentation does not cover. Users with very high query counts are your power users -- their feedback is especially valuable.
This section is hidden if all feedback is anonymous.
Documentation Gaps
Lists the 10 most recent queries with negative feedback, showing:
- The original query text
- A truncated response summary (what Planara answered)
- Timestamp and session ID
What to look for: Patterns in negative queries often reveal missing documentation. If multiple users ask similar questions and rate them negatively, that topic needs new content.
Product Analytics Integration
Analytics data is also streamed to a product analytics platform for cross-platform analysis. Events are captured from three sources:
- Server-side -- query execution, eval runs, regression detection, cache hits. All calls are fire-and-forget; if analytics is not configured, tracking is silently disabled.
- Technician frontend -- page views, query submissions, widget interactions, chat usage.
- Backoffice -- document uploads, eval management actions, configuration changes. Reported separately from the technician frontend.
Key events tracked
| Event | Source | Description |
|---|---|---|
query_executed | Server | Every query with namespace, role, latency, confidence, skill |
eval_run_completed | Server | Nightly/manual eval with pass rate and query count |
eval_regression_detected | Server | Fired when nightly eval finds a regression |
feedback_submitted | Frontend | Thumbs up/down with session context |
widget_promoted | Frontend | Rail widget tapped to hero position |
document_ingested | Backoffice | New document uploaded and processed |
Events are associated with each tenant (the namespace), enabling per-tenant dashboards without additional filtering.
For adoption-specific analytics (funnels, leaderboards, ROI), see the Adoption Dashboard.
CSV Export
Every section has an "Export CSV" button. Downloaded files include the namespace and date range in the filename:
analytics-daily-{namespace}-{from}-{to}.csvanalytics-users-{namespace}-{from}-{to}.csvfeedback-{namespace}-{date}.csv(from the export button below the filter controls)
Overview Dashboard
Your workspace home page — KPIs, query volume, field intelligence metrics, documentation gaps, and system health.
Adoption & Network Intelligence
Track adoption across your dealer network, measure field intelligence capture, calculate ROI, and surface resolution patterns the OEM can act on.