Integration Architecture
How Planara connects to external systems — DMS, telemetry, ERP, and identity providers
Planara uses an adapter pattern for all external integrations. The frontend never knows where data comes from. It speaks a set of typed interfaces. Behind those interfaces, an adapter translates between the external system's API and Planara's data model.
This means adding a new DMS provider, telemetry source, or ERP system does not require any frontend changes. It requires one new adapter that implements the existing interface.
How It Works
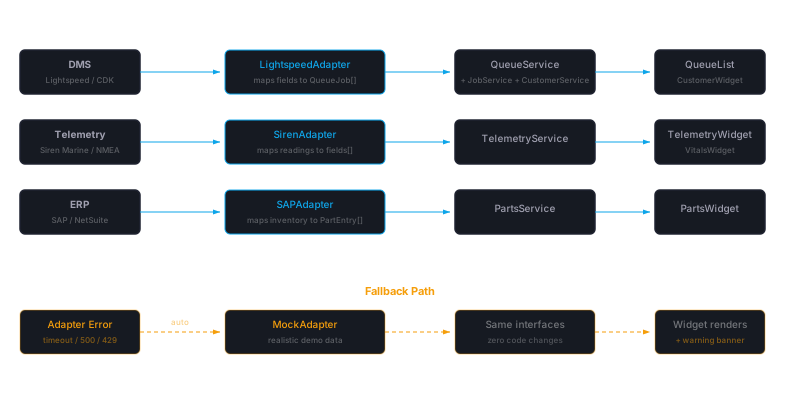
Every widget in the technician dashboard consumes data through a service interface. The interface defines the shape of the data. The adapter provides the data from whatever source is configured.
External System --> Adapter --> Service Interface --> Widget

Example: DMS Integration

Lightspeed EVO                    QueueService
      |           Lightspeed           |
      +----------> Adapter ----------->+---> QueueList widget
                      |                |
                  Maps fields       Returns
                  to QueueJob[]    QueueJob[]


Example: Telemetry Integration

Siren Marine                      TelemetryService
      |           Siren Marine         |
      +----------> Adapter ----------->+---> TelemetryWidget
                      |                |
                  Maps readings     Returns
                  to fields[]      TelemetryProfile
The Full Data Flow
+------------------+     +------------------+     +------------------+
|  External System |     |  Adapter Layer   |     |  Widget Layer    |
|                  |     |                  |     |                  |
|  Lightspeed API -+---->+ LightspeedQueue  +---->+ QueueList        |
|  Siren Marine   -+---->+ SirenTelemetry   +---->+ TelemetryWidget  |
|  SAP Parts      -+---->+ SAPParts         +---->+ PartsWidget      |
|  (none)         -+---->+ MockAdapter      +---->+ (demo data)      |
+------------------+     +------------------+     +------------------+
When no external system is configured, the MockAdapter provides demo data. This is how the platform works out of the box — every widget renders with realistic sample data so the customer can evaluate the experience before connecting their systems.
Service Interfaces
These are the contracts that widgets consume. Every adapter must implement these interfaces. The frontend imports the interface, not the adapter. Swapping from mock to Lightspeed to CDK requires zero frontend code changes.
QueueService
Provides the job queue — work orders assigned to the logged-in technician.
interface QueueJob {
  id: string;                // Work order number
  label: string;             // Vessel/asset name
  sublabel: string;          // Make and model
  equipment: string;         // Engine model
  equipmentCount: number;    // Number of engines
  hours: number;             // Engine hours
  complaint: string;         // Customer complaint summary
  priority: "high" | "normal" | "low";
  faultCode: string | null;
  faultDescription: string | null;
  partsStatus: "staged" | "ordered" | "not_staged";
  assessmentReady: boolean;
  bay: string;
  customer: string;
  assignedAt: string;        // ISO timestamp
}

interface QueueService {
  getJobs(): Promise<QueueJob[]>;
}
Powered by: DMS integration (Lightspeed, CDK, DockMaster) or mock data.
JobService
Loads full work order detail and supports creating draft jobs from manual input.
interface DraftJobInput {
  description: string;
  equipmentId?: string;
  faultCodes?: string;
  customerName?: string;
  assetName?: string;
}

interface JobService {
  loadWorkOrder(jobId: string): Promise<WorkOrder>;
  createDraft(input: DraftJobInput): WorkOrder;
}
Powered by: DMS integration or local state (for manually-created jobs via the New Job sheet).
TelemetryService
Provides live engine readings and event history for charting.
interface TelemetryField {
  key: string;              // e.g. "coolant_temp_f"
  label: string;            // e.g. "Coolant Temp"
  value: number | null;     // Current reading
  unit: string;             // e.g. "F", "PSI", "RPM"
  warn_low: number | null;
  warn_high: number | null;
  critical_low: number | null;
  critical_high: number | null;
}

interface TelemetryEvent {
  id: string;
  date: string;
  time: string;
  peak: number;
  rpm: number;
  severity: "critical" | "warning" | "info";
  data: { t: string; v: number }[];  // Time-series for charting
}

interface TelemetryProfile {
  events: TelemetryEvent[];
  threshold: number;
  unit: string;
  domain: [number, number];
  ticks: number[];
  fields: TelemetryField[];
}

interface TelemetryService {
  getReadings(engineId: string): Promise<TelemetryReading[]>;
  getEventProfile(faultCode?: string): Promise<TelemetryProfile>;
}
Powered by: Telemetry integration (Siren Marine, NMEA 2000, Yamaha CL7) or mock data.
The fields array is dynamic — it contains whatever readings the telemetry source provides, with thresholds for each. The TelemetryWidget renders gauges automatically based on the fields present. No code changes needed when a new sensor type is added.
PartsService
Provides parts for a work order — inventory, pricing, bin locations.
interface PartEntry {
  partNumber: string;
  description: string;
  quantity: number;
  status: string;           // "in_stock", "ordered", "backordered"
  binLocation: string;
  unitCost: number;
}

interface PartsService {
  getPartsForJob(woNumber: string): Promise<PartEntry[]>;
}
Powered by: ERP integration (SAP, NetSuite) or DMS parts module (Lightspeed) or mock data.
CustomerService
Provides customer contact info and service history for the current asset.
interface CustomerInfo {
  name: string;
  phone: string;
  email?: string;
}

interface ServiceHistoryEntry {
  date: string;
  hoursAtService: number;
  description: string;
}

interface CustomerService {
  getCustomer(woNumber: string): Promise<CustomerInfo>;
  getServiceHistory(assetId: string): Promise<ServiceHistoryEntry[]>;
}
Powered by: DMS integration or mock data.
ServiceAdapter (Aggregate)
All services bundled. Every adapter implementation provides the full set.
interface ServiceAdapter {
  queue: QueueService;
  job: JobService;
  telemetry: TelemetryService;
  parts: PartsService;
  customer: CustomerService;
}
The frontend instantiates one ServiceAdapter at startup. Which implementation it uses is determined by configuration. Today: MockAdapter for demo, with real adapters built per customer as integrations are connected.
Building a Custom Adapter
For customers with development teams who want to connect their own systems directly, or for Planara team members building new provider support.
Step 1: Implement the Interface
Create a new adapter that implements ServiceAdapter (or a subset — not every service needs to be real).
// Example: a partial adapter that provides real queue data
// but falls back to mock for everything else

import { MockAdapter } from "./mock-adapter";
import type { ServiceAdapter, QueueService, QueueJob } from "./types";

class LightspeedQueueService implements QueueService {
  constructor(private apiUrl: string, private apiKey: string) {}

  async getJobs(): Promise<QueueJob[]> {
    const response = await fetch(`${this.apiUrl}/work-orders`, {
      headers: { Authorization: `Bearer ${this.apiKey}` },
    });
    const data = await response.json();
    return data.work_orders.map(mapLightspeedToQueueJob);
  }
}

// Compose: real queue, mock everything else
export function createLightspeedAdapter(
  config: { apiUrl: string; apiKey: string }
): ServiceAdapter {
  const mock = new MockAdapter();
  return {
    queue: new LightspeedQueueService(config.apiUrl, config.apiKey),
    job: mock.job,
    telemetry: mock.telemetry,
    parts: mock.parts,
    customer: mock.customer,
  };
}
Step 2: Map Fields
The mapping function translates the external system's data shape to Planara's interface. This is where provider-specific logic lives.
function mapLightspeedToQueueJob(wo: LightspeedWorkOrder): QueueJob {
  return {
    id: wo.wo_number,
    label: wo.unit?.name || "Unknown",
    sublabel: `${wo.unit?.make || ""} ${wo.unit?.model || ""}`.trim(),
    equipment: wo.unit?.engine_model || "Unknown",
    equipmentCount: wo.unit?.engine_count || 1,
    hours: wo.unit?.hours || 0,
    complaint: wo.complaint_description || "",
    priority: wo.priority === "rush" ? "high" : "normal",
    faultCode: wo.dtc_codes?.[0]?.code || null,
    faultDescription: wo.dtc_codes?.[0]?.description || null,
    partsStatus: mapPartsStatus(wo.parts_status),
    assessmentReady: wo.status === "assigned",
    bay: wo.bay_number || "",
    customer: wo.customer?.name || "",
    assignedAt: wo.assigned_at || new Date().toISOString(),
  };
}
Step 3: Register the Adapter
In the backoffice Integrations page, create an integration entry with the provider, endpoint URL, and API key. The adapter layer reads this configuration at startup and instantiates the correct adapter.
Step 4: Test
Use the backoffice Test Connection button to verify the endpoint is reachable. Then load the technician dashboard and confirm the widget renders real data.
Error Handling and Fallback
Every adapter is wrapped in error handling that falls back to the mock adapter on failure. This means a DMS outage does not break the technician dashboard — it degrades gracefully to demo data with a "Connection error — showing cached data" indicator.
Normal flow:
  External API --> Adapter --> Widget (real data)

Error flow:
  External API --> Adapter --> ERROR
                      |
                      v
              MockAdapter --> Widget (demo data + warning banner)
The fallback is automatic. No configuration needed. The widget displays a subtle indicator when showing fallback data so the technician knows the information may not be current.
Rate Limiting and Caching
Polling Intervals
For REST-based integrations (DMS, telemetry polling):
| Integration Type | Default Poll Interval | Configurable |
|---|---|---|
| DMS Queue | 60 seconds | Yes |
| Telemetry | 30 seconds | Yes |
| Parts Inventory | 300 seconds | Yes |
Poll intervals are configurable per integration in the backoffice. Shorter intervals mean fresher data but more API calls to the external system.
Response Caching
API responses from external systems are cached in memory with a TTL matching the poll interval. This means:
- Multiple widgets requesting the same data within one poll cycle get the cached response
- A page refresh does not trigger a new external API call if the cache is still valid
- Cache is invalidated immediately on manual refresh or when the poll interval expires
Rate Limit Handling
If an external API returns a 429 (rate limited), the adapter:
- Serves the cached response if available
- Backs off exponentially (2s, 4s, 8s, 16s, max 60s)
- Logs the rate limit event in the backoffice integration status
- Resumes normal polling when the rate limit clears
Webhook Support
Status: [PLANNED]
For integrations that support it, webhook push is preferred over polling. The external system sends events to a Planara endpoint when data changes — new work order created, telemetry reading received, parts status updated.
Benefits over polling:
- Real-time updates (no poll interval delay)
- Lower API call volume on the external system
- Event-driven architecture (process only changes, not full snapshots)
When available, webhook endpoints will be registered in the backoffice Integrations page alongside the polling configuration.
Integration Types at a Glance
| Type | Direction | Powers These Widgets | Common Providers |
|---|---|---|---|
| DMS | Pull | Queue, Job Summary, Customer, Service History | Lightspeed, CDK, DockMaster |
| Telemetry | Pull or Push | Telemetry Gauges, Vitals, Event Timeline | Siren Marine, NMEA 2000, Yamaha CL7 |
| ERP / Parts | Pull | Parts Availability, Pricing | SAP, NetSuite, QuickBooks |
| Notification | Push | Alerts (SMS, email, Slack, webhook) | SendGrid, Twilio, Slack |
| Identity | Federation | User Auth, Role Assignment | Azure AD, Okta, Google Workspace |
For Planara Team: Adding a New Provider
- Get the provider's API documentation and sandbox credentials
- Create the adapter class implementing the relevant service interface(s)
- Write the field mapping function
- Add the provider name to
PROVIDER_SUGGESTIONSin the backoffice integrations page - Test with sample data in the sandbox
- Deploy the adapter
- Update the integration type's documentation in the docs site